The Ultimate Guide to
How Feedalyze v2 Detects Churn Risk Per Account — Not Just Per File
The Problem with File-Based Analysis
We built Feedalyze because manually parsing through hundreds of support tickets was a nightmare. Our initial model gave agencies and SaaS businesses a fast, accurate way to analyze documents: upload a CSV file of feedback and get a comprehensive sentiment report.
But there was a fundamental flaw. It treated feedback as an undifferentiated blob. When you blend all feedback together, an incredibly happy power user and a frustrated, at-risk churner average out into a single "neutral" score. A CSV-level sentiment score tells you almost nothing about individual account health. You don't churn files; you churn customers.
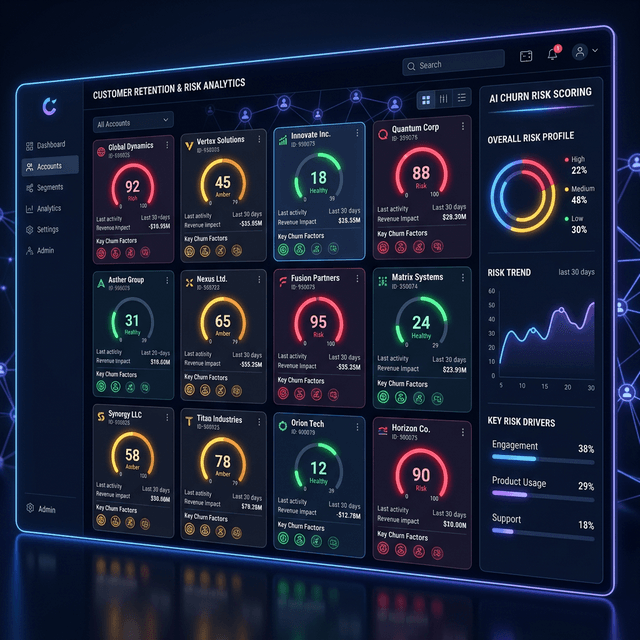
What's New in v2: Per-Account Churn Scoring
Feedalyze v2 shifts the entire paradigm from analyzing documents to analyzing *customers*. Now, every specific piece of feedback, every support interaction, and every behavioral event is directly tethered to a specific account identifier.
Instead of generating a generic, blended average, our AI now models churn risk per account on a strict 0–100 scale. A score of 91 signals an immediate, acute problem requiring direct intervention. A score of 12 indicates a happy champion you can likely upsell. You no longer have to manually synthesize who is unhappy—the platform ranks your entire customer base side-by-side.
The Three Signal Types
A reliable churn prediction model cannot look at text alone. We triangulate the churn risk score using three distinct signal categories simultaneously:
How the Weekly At-Risk Digest Works
We know Customer Success managers are strapped for time and don't want to dig through dense dashboards. Feedalyze v2 automates visibility.
Every Monday morning, the platform runs a full scoring model across all active accounts and automatically sends a crisp Digest Email directly to your inbox. This digest highlights only the top 5 at-risk accounts. You immediately see their current churn score, their 30-day trajectory, and exactly which risk signals tripped the alarm. You can start your week knowing exactly who to call before they click the cancel button.
Integrations
To make per-account scoring completely frictionless, we've replaced manual CSV exports with native direct integrations. Your data streams into our analysis engine automatically:
HubSpot
: A 1-click OAuth integration instantly syncs your contact notes, their current lifecycle stage, and the date of their last logged activity.
Intercom
: Connect via OAuth to automatically pipe in conversation history, support ticket sentiment, and recent CSAT score variations.
Segment / Webhooks
: Just paste your write key to stream behavioral events (like logins and specific feature usage drops) directly into the AI models.
*(For teams that aren't ready to set up an integration, don't worry—the robust CSV upload process still works perfectly. Simply include columns like `company_name`, `login_count`, and `support_tickets` side-by-side with your feedback text.)*
The Report: What You Actually See
Once an account is scored, they get an entirely redesigned, dedicated Account Report Page. Stop jumping back and forth between tools. On this page, you get:
How to Get Started in 5 Minutes
You can start scoring individual accounts and predicting churn today with zero engineering overhead. Here’s a quick guide:
Add your first account
: Go to your dashboard and hit "+ Add Account", then enter their company name.
Upload feedback history
: If you don't have HubSpot or Intercom connected yet, just drop in a CSV that includes `account_id`, `feedback_text`, `login_count_30d`, and `support_tickets_30d`.
Let the AI score it
: Feedalyze will immediately crunch the data and generate your first full Account Health Report.
Set it and forget it
: Enable a weekly automated schedule so you get updated scores every Monday morning.
Stop guessing which accounts are about to churn out. [Start your free analysis today](/analyze) and get your first 3 accounts scored on us—no credit card required.
Turn messy feedback into growth.
Automate your client feedback analysis. Detect churn risk and extract actionable insights in seconds with our AI-powered engine.